

Structure
- Instrument: BTCUSDT · 1d · bullish
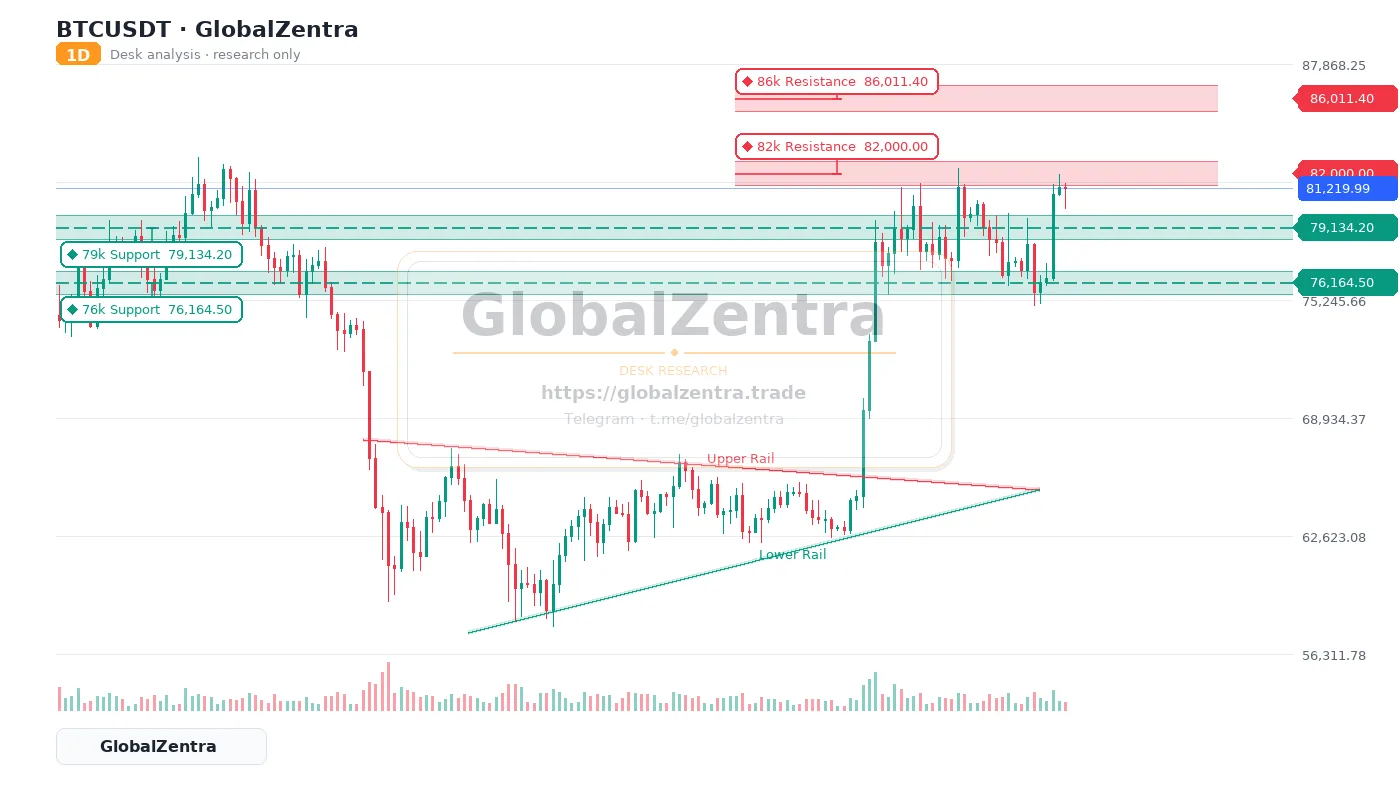
- Pattern: Symmetrical Triangle — Breakout above the upper rail suggests bullish continuation towards 82k and 86k. Watch for volume confirmation on the breakout.
- Trendline descending: 80366.5 → 80366.5 (Upper Rail)
- Trendline ascending: 67293.2 → 80366.5 (Lower Rail)
- Zone resistance: 85323.3–86699.5 (86k Resistance)
- Zone resistance: 81344–82656 (82k Resistance)
- Zone support: 78501.1–79767.3 (79k Support)
- Zone support: 75555.2–76773.8 (76k Support)
- Zone support: 72473.3–73642.3 (73k Support)
- Zone support: 69614.1–70736.9 (70k Support)
Research only
This note summarizes the source chart geometry for the GlobalZentra desk. It is not a trade ticket and does not invent ENTRY, TP, or SL levels.